
CI
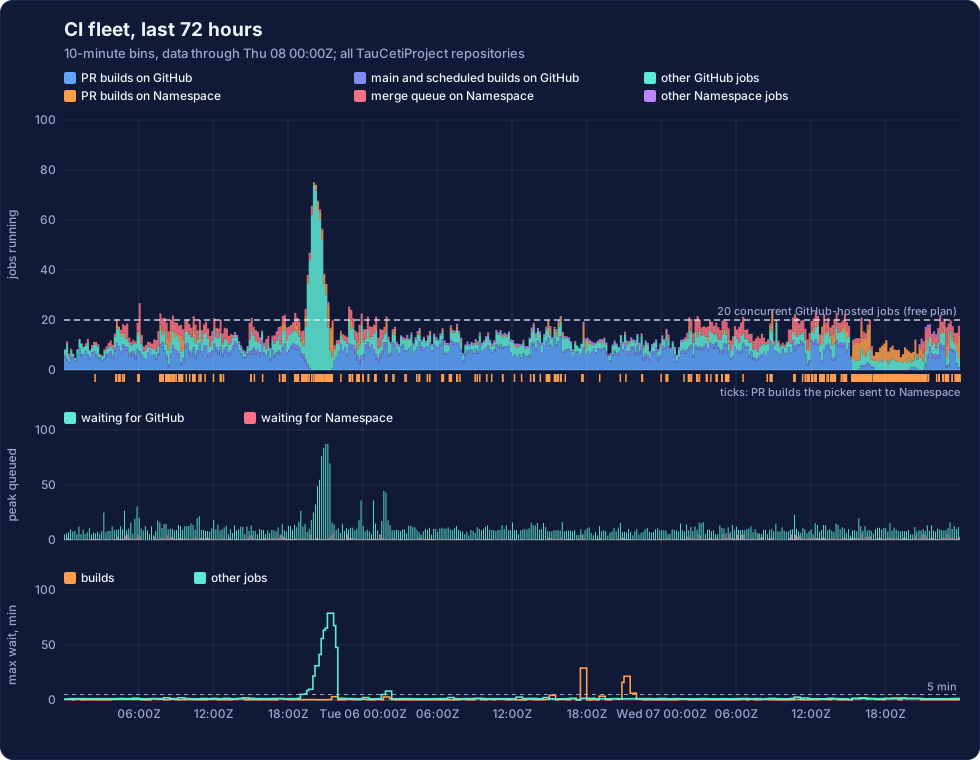
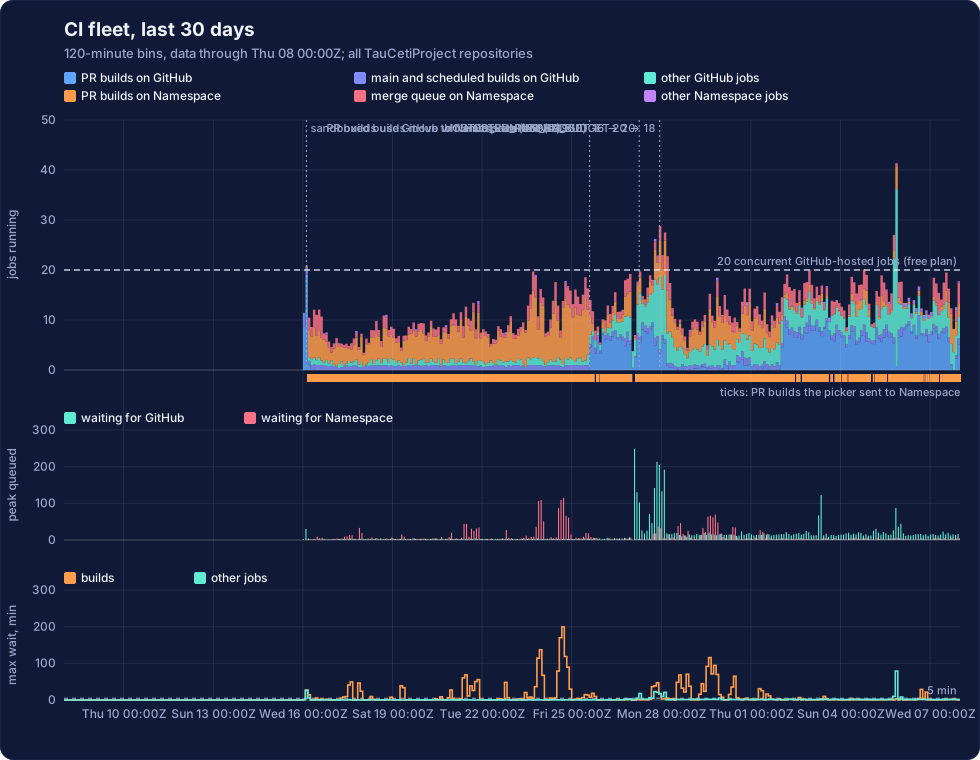
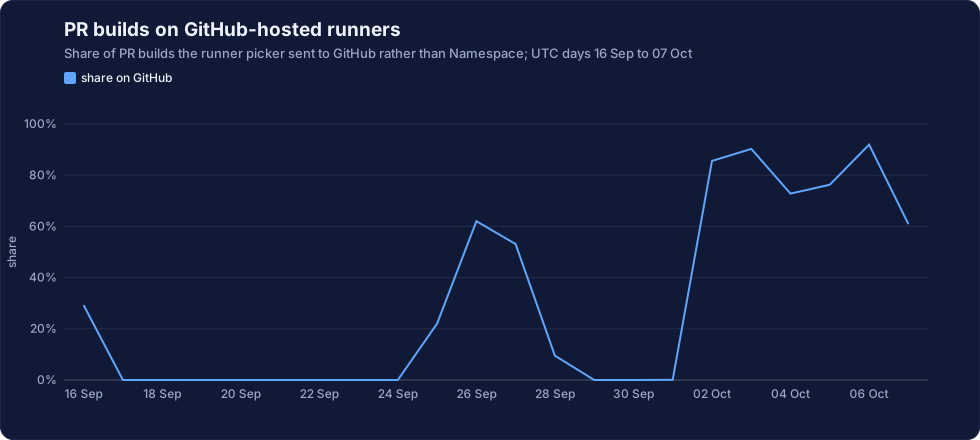
Where does Tau Ceti's continuous integration run, and how long does it wait? Every pull request is built in a sandbox, on one of two kinds of runner. GitHub-hosted runners cost nothing for a public repository, but the organisation may run only twenty GitHub-hosted jobs at once, across all of its repositories. Namespace runners are faster and have no such cap, but every minute is paid for. So a pull-request build takes a GitHub runner while one is free and overflows to Namespace when they are all taken; the merge queue, which every pull request must pass to land, always builds on Namespace.
The timeline below has three panels on one time axis. The top panel shows how many jobs were running, averaged over each bin and stacked by runner and kind, against the twenty-job cap on GitHub-hosted jobs. "Other GitHub jobs" are mostly the label, notification and merge-bot jobs that run on every pull-request event; they are brief but numerous, and they compete with builds for the same twenty slots. Ticks below the panel mark pull-request builds that the runner picker sent to Namespace, and dotted lines mark changes to the CI configuration. The middle panel shows the most jobs waiting for a runner at any moment in each bin. The bottom panel shows the longest wait for a runner among jobs that started in the previous thirty minutes (or the previous bin, when bins are longer), for builds and for other jobs separately.
Day by day
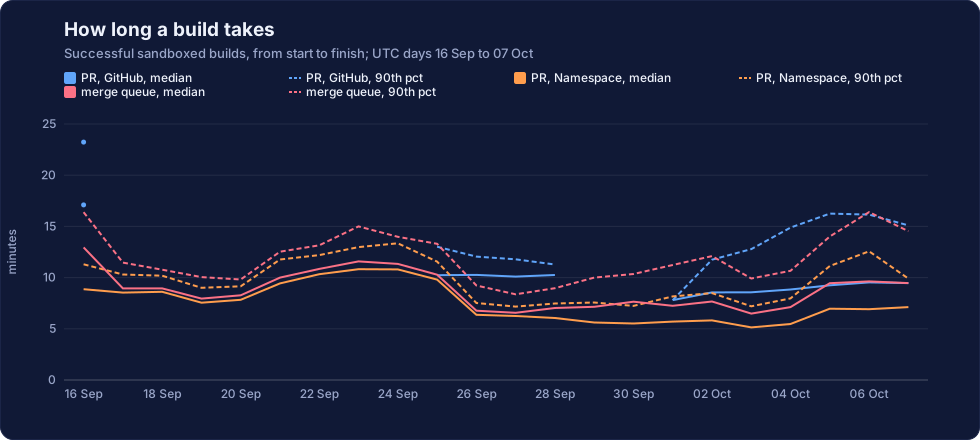
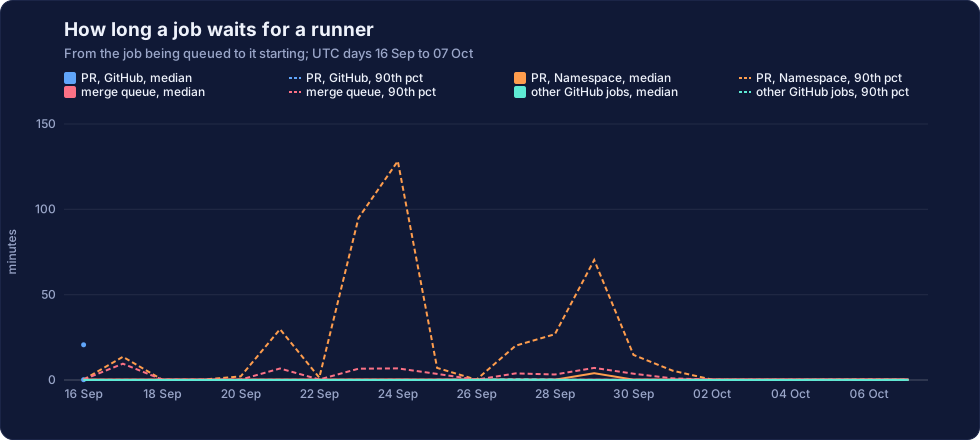
The charts below give one point per complete UTC day, for up to the last ninety days.
How long does a build take, and how long does it wait before starting? A pull-request build restores what it can from the artifact cache and compiles the rest, then runs the audits and lints. Builds on Namespace run on eight-core machines and those on GitHub-hosted runners on four, so the two lines are different machines doing broadly similar work, not the same builds timed twice.
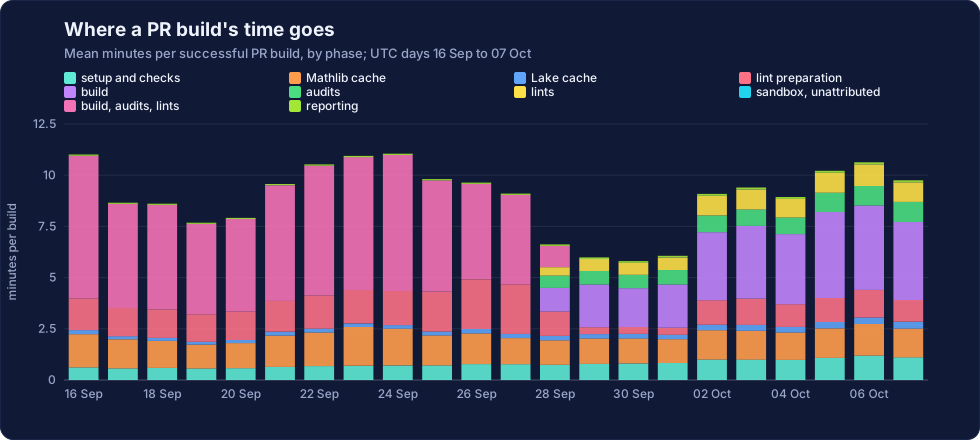
Where does a build's time go? The build, the audits and the two lints run in one sandboxed step. Where a build recorded its own phases, that step is split into them, with any time the phases do not cover shown as unattributed; otherwise it appears as one block.
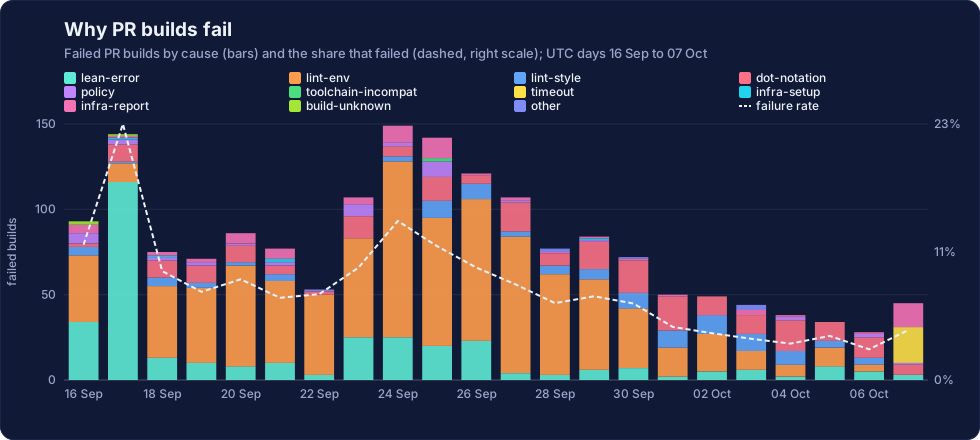
Why do builds fail? Each failed pull-request build is classified by the step that failed and the error lines it printed: a Lean error, one of the lints, one of the audits, a policy check (scope, size, pins), a timeout, or an infrastructure fault such as a cache download. The classification is by pattern, so it is a guide rather than a verdict.
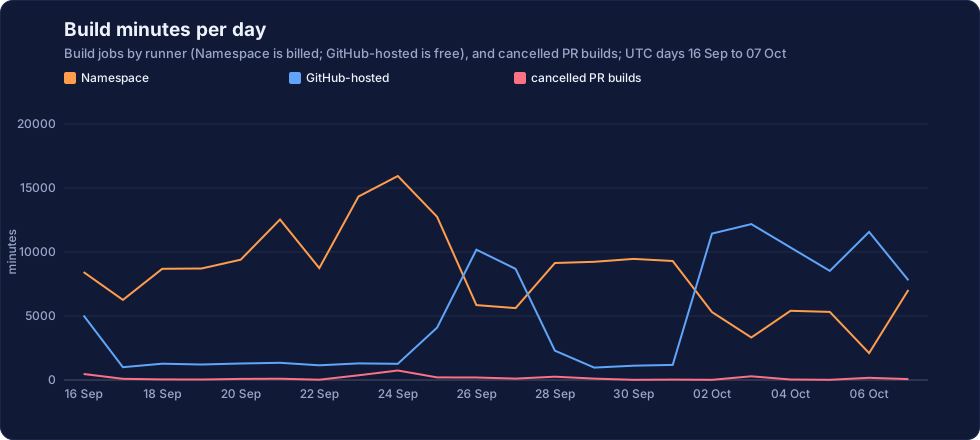
What does it cost? Namespace bills every minute; GitHub-hosted minutes cost nothing for a public repository. The chart counts the minutes of build jobs. A cancelled PR build is usually one that a newer push to the same pull request replaced before it finished, whose minutes bought nothing.
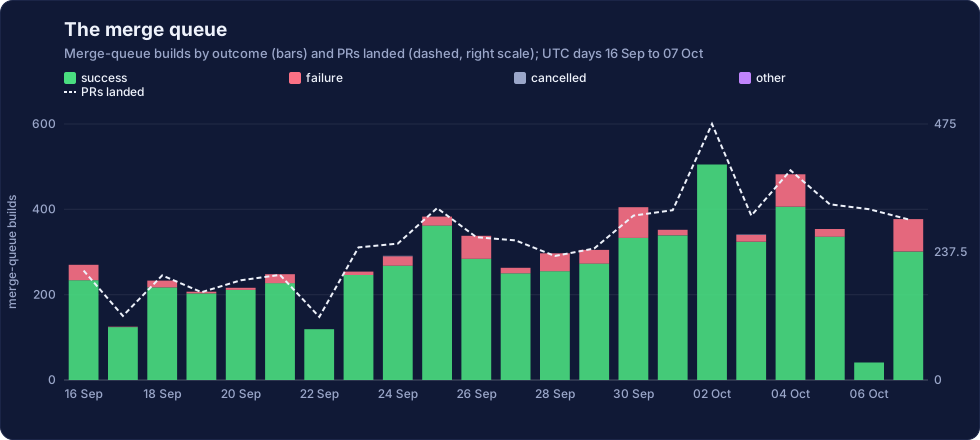
How is the merge queue doing? The queue builds each pull request together with those ahead of it, and lands them only if that combined build passes. When one fails, its pull request leaves the queue and the entries behind it, whose builds included it, are built again. The bars count build jobs, including retries.
Where the data comes from
The data comes from TauCetiCI, which records every GitHub Actions run in the organisation: the commits each build tested, the runner, the queue and run times of its jobs, and why failed builds failed. Its database is published as a release there for anyone who wants to ask their own questions. The charts end where that record is complete, which can be a few hours behind the present.
Builds are recorded job by job. The label, notification and merge-bot workflows run thousands of times a day, so for them only one run in four is recorded job by job, and each of those stands for the unrecorded runs of its workflow in the same hour. Their share of the running and queued panels is therefore an estimate, and their longest waits come from the sample. Before hourly collection began, none of their runs were recorded job by job; there the running panel places an estimated job at the end of each run, and the queue and wait panels leave those runs out.