
CI
The merge queue, CI jobs and dedicated hosts share this operational view. Each source reports its own freshness.
Loading queue and runner observations…
Historical chart source status
Chart publisher cache · all organisation workflow jobs
Loading chart source status…
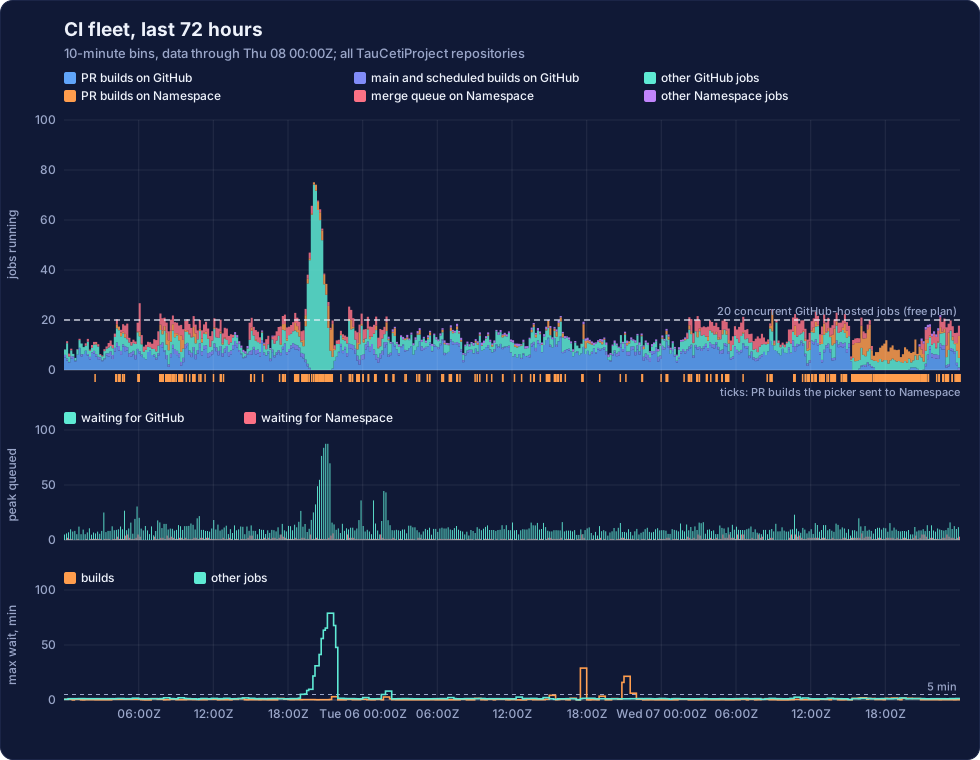
Understanding the fleet
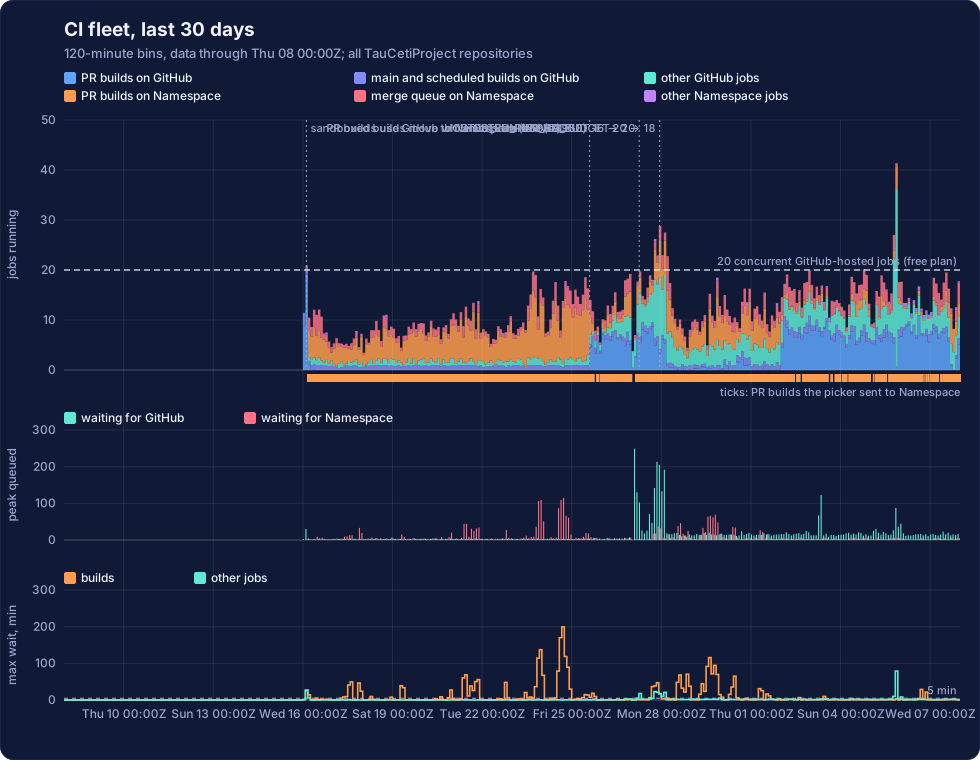
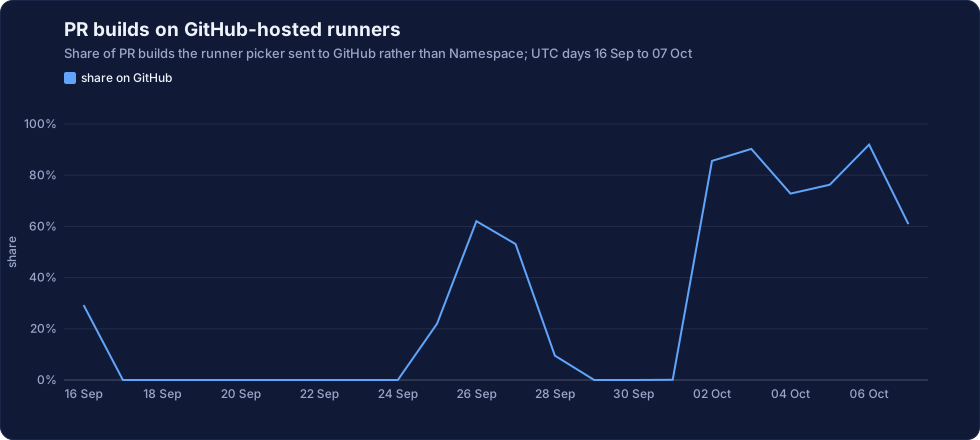
Every pull request is built in a sandbox. GitHub-hosted and Namespace runners provide cloud capacity; dedicated servers also run disposable CI guests and mathematics workers. The Runners tab shows every published host, including hosts with CI disabled. Routing and available slots change with the configured fleet policy. A requested cloud profile is not a measurement of physical utilization. Unobserved resource fields stay unknown.
The queue owns admission, exact candidate versions, CI verdict bindings and landings. Its head runs staging CI while repair and preparation work can overlap it. A failed source build supplies repair evidence; the repaired candidate is tested again before promotion. The timelines retain each run attempt, including superseded candidates. Observer failures preserve the last known work and are reported separately from build silence.
Merge queue and staging runs
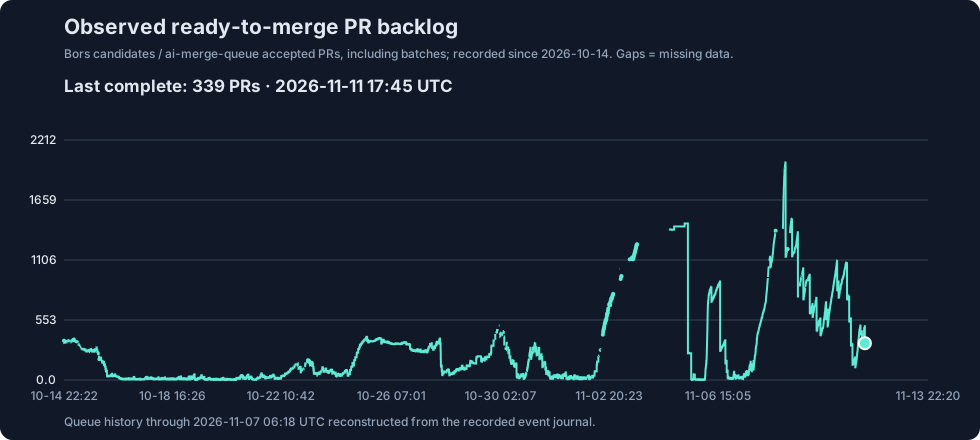
How many pull requests are waiting to land, and how large are the batches bors tests?
These timelines show up to the last thirty days, including the current partial UTC day.
The backlog counts distinct PRs in the recorded ready-to-merge snapshots, including PRs
being tested. The label is a readiness hint; admission still checks the current head's CI,
reviews and scope. Missing observations leave gaps, and the line stops at the last sample.
Initial candidate scans after a bot restart are omitted when their incompleteness is recorded.
Older snapshots without that marker can briefly undercount.
The latest complete count and its snapshot time appear below the chart. "Chart published"
is when the chart was generated; its newest complete snapshot can be older, especially
while a new scan is incomplete. During later scans, bors may reuse the previous complete
snapshot. The ready-labelled backlog can differ from the active-batch total reported by
tauceti-fleet status, which counts PRs already assigned to bors batches.
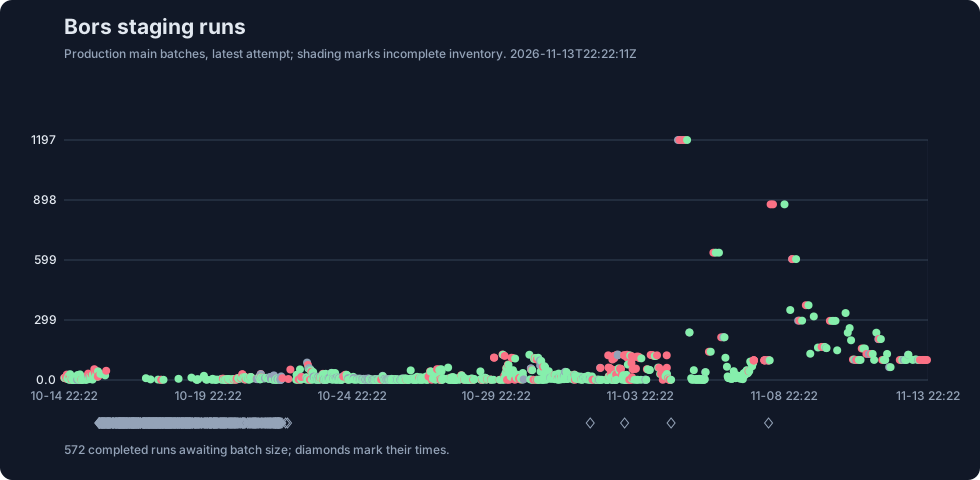
Each staging dot is placed at the run's creation time, with the number of distinct PRs in its batch on the vertical axis. The colour records the overall workflow result, including cache publication, using the latest recorded attempt if the run was retried. Separate runs of the same batch have separate dots. Only production main-branch staging runs with known batch membership and a terminal result are shown; pilot and unidentified dispatches are excluded. Shaded intervals mark incomplete run inventory: recorded dots are shown there, but missing dots do not establish that no runs occurred.
Day by day
Live reports give one point per UTC day for up to the last ninety days. Today's point is provisional and changes as builds finish and details arrive. Each chart reports its own source coverage. The static fallback charts include complete UTC days only.
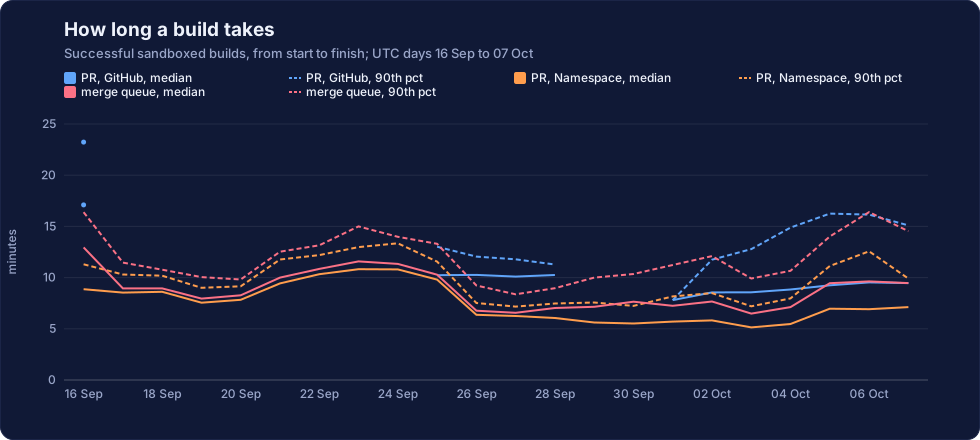
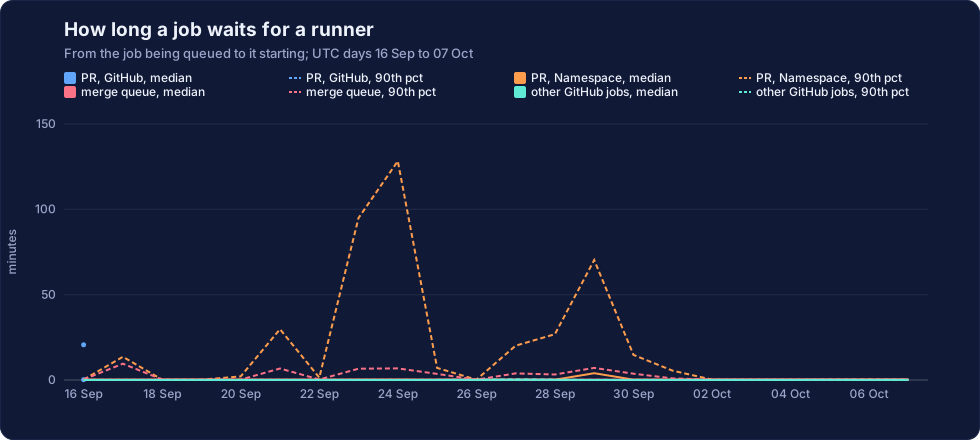
How long does a build take, and how long does it wait before starting? A pull-request build restores what it can from the artifact cache and compiles the rest, then runs the audits and lints. PR build durations and waits are separated by runner; the merge-validation series combines staging builds across providers. These timings reflect different runner sizes and workloads.
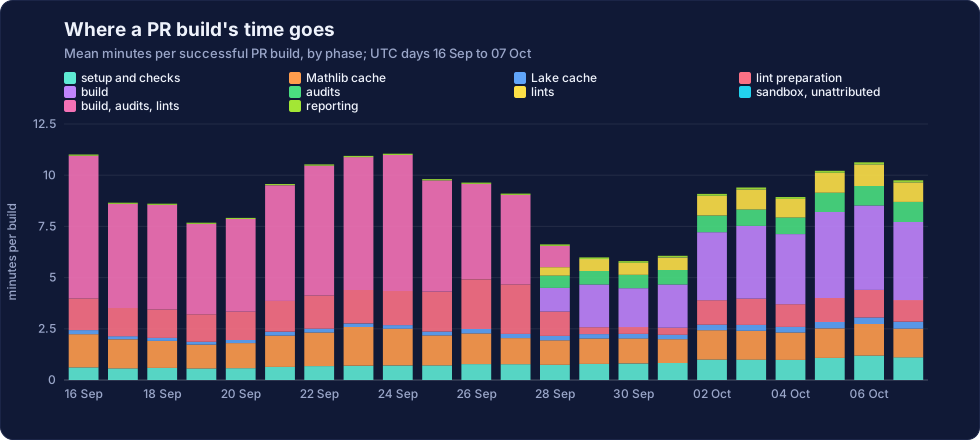
Where does a build's time go? The build, the audits and the two lints run in one sandboxed step. For a sample of successful builds with recorded phases, that step is split into them, with any time the phases do not cover shown as unattributed. Days with recorded phase samples use the sampled builds for the phase means; other days retain coarse API step timings.
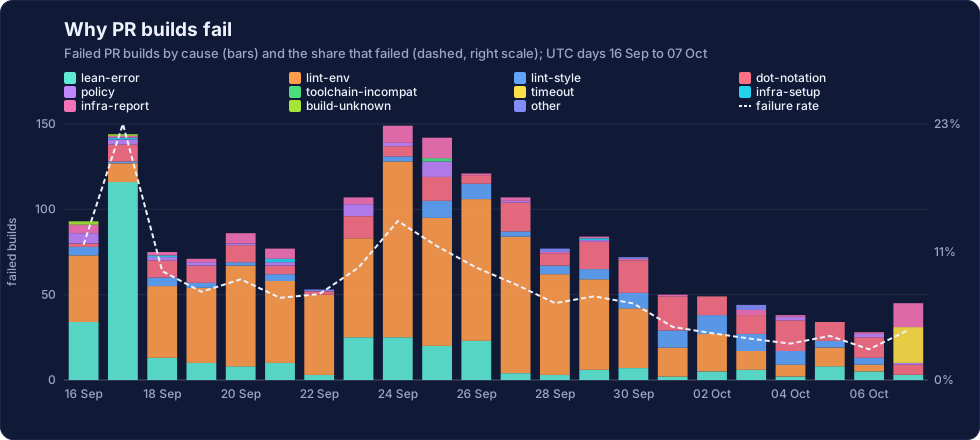
Why do builds fail? Each failed pull-request build is classified by the step that failed and the available error lines it printed: a Lean error, one of the lints, one of the audits, a policy check (scope, size, pins), a timeout, or an infrastructure fault such as a cache download. The classification is by pattern, so it is a guide rather than a verdict. Optional failure details are limited to recent builds; unavailable causes remain unknown.
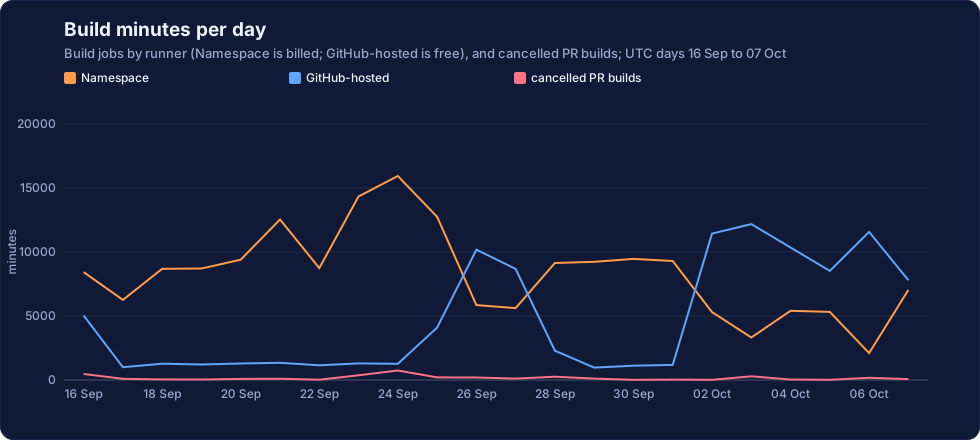
What does it cost? Namespace bills every minute; GitHub-hosted minutes cost nothing for a public repository. The eastanglia and leanfro servers contribute operator-provided capacity. The chart counts build-job minutes separately for each runner provider. A cancelled PR build is usually one that a newer push to the same pull request replaced before it finished, whose minutes bought nothing.
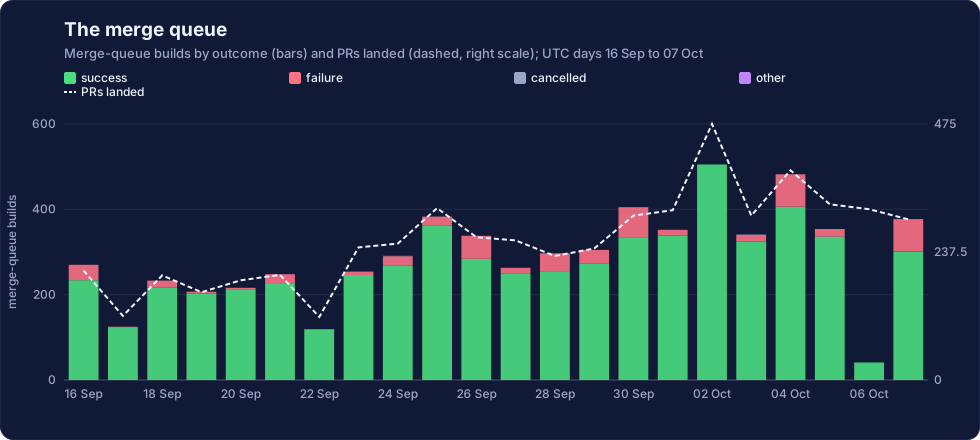
How is merge validation doing? The chart includes both GitHub's merge queue and bors staging builds. Both test combined changes before they land on main. GitHub rebuilds the entries behind a failed entry; historical bors batches used splitting, while the current queue repairs a failed combined candidate. The bars count build jobs, including retries, so a bors batch containing several PRs is one build. Pilot batches and bors builds whose target branch is unknown are excluded from this chart.
The dashed line counts each PR once, on the date of the earliest recorded main-push event proving its commit reached main. The event time is an upper bound on arrival; coalesced pushes can make that bound looser for ancestor commits. The staging commit's creation time is not used. PRs without arrival evidence are excluded from that line. Direct merges of human-reviewed infrastructure PRs are included.
Where the data comes from
The data comes from TauCetiCI. Its live reporting service receives GitHub workflow and job events, repairs current missing data and samples optional details within a shared GitHub request budget. New and corrected records update the affected time buckets. Reports update independently of this website's build, and the page checks for published operations updates every five seconds while visible; historical charts keep their separate cadence. Reading this page does not trigger GitHub API requests. During validation or an outage, the page retains its static or last successful reports.
The live report manifest records publication times, source coverage and pending details. The existing downloadable database remains available as a historical release; it is refreshed only for an explicit analysis. Static fallbacks cache the published charts rather than rebuilding them from the database. Each chart uses its own source coverage: fleet charts require organisation-wide job history, daily build charts require Tau Ceti build jobs, failure and phase charts require detailed enrichment, and the merge timelines use the latest observations and recorded runs. Explicitly unavailable records are reported as source gaps. A backlog in one stream does not stop the others. The freshness report distinguishes source coverage from the coverage used for published charts. Dated daily charts can incorporate historical corrections even while their coverage is stale; the freshness check still reports that lag. Stale fleet and merge timelines retain their previous assets. When source data cannot be read or rendered, the previous charts are retained. A fallback's published cutoff may be unknown when no earlier report recorded it.
Live workflow events record jobs individually. Older archives sampled the label, notification and merge-bot workflows, which run thousands of times a day: one run in four was recorded job by job, and each of those stands for the unrecorded runs of its workflow in the same hour. Their share of the running and queued panels is therefore an estimate, and their longest waits come from the sample. Before hourly collection began, none of their runs were recorded job by job; there the running panel places an estimated job at the end of each run, and the queue and wait panels leave those runs out.