
Internal health
How is the pipeline doing?
For operators and maintainers: the flow of pull requests, where they are waiting, how long until the roadmaps run out of work, and the state of CI.
Where pull requests wait
Open pull requests by lifecycle stage
Current depth of each stage, with how long its pull requests have been waiting and how fast they move through it compared with the last fourteen days.
Loading…
Age of open pull requests
Time since each open pull request was created.
Loading…
Review rounds per pull request
How many times reviewed pull requests have entered review:
Loading…
Merges, trailing seven days
Pull requests merged in each trailing seven-day window.
Loading…
Time from opening to merge
Median and 90th percentile, trailing seven days, in hours.
Loading…
When do we run out of work?
Loading…
Layers not yet recorded done, divided by the recent pace at which layers are completed (layer completions per added line of Lean, times the last seven days’ growth). Layers differ in difficulty and reports lag the code, so read this as a rough order of magnitude.
CI
Open the live CI dashboard for the merge queue, PR lookup, runner activity, dedicated hosts and complete CI history. Each source reports its own freshness and updates while the page is visible.
Loading the CI snapshot…
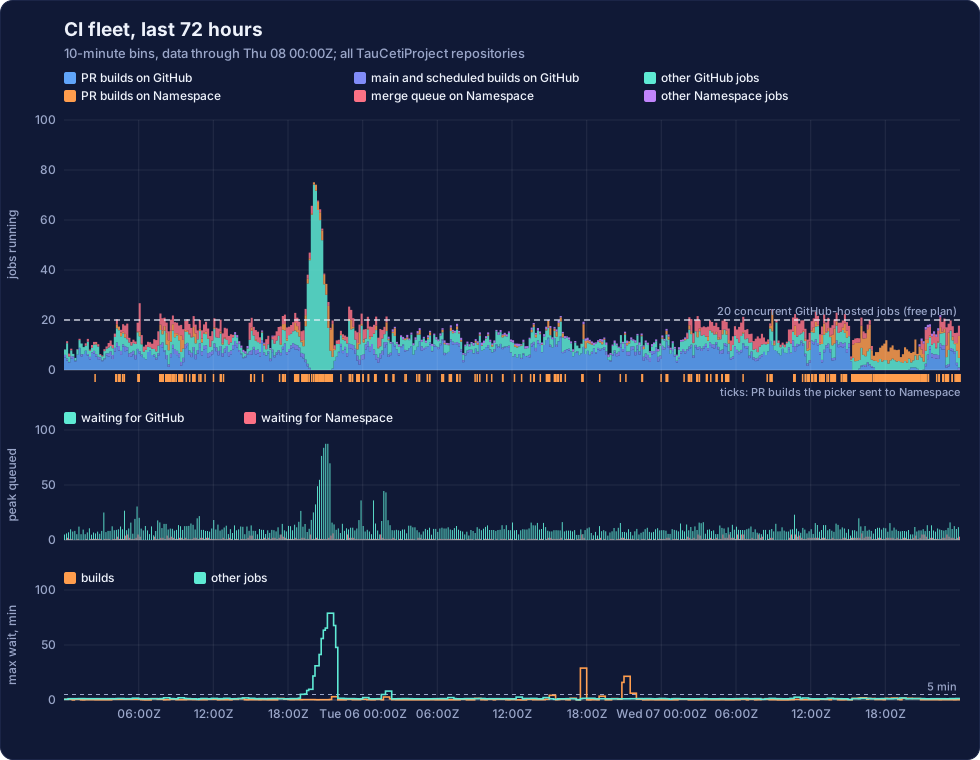
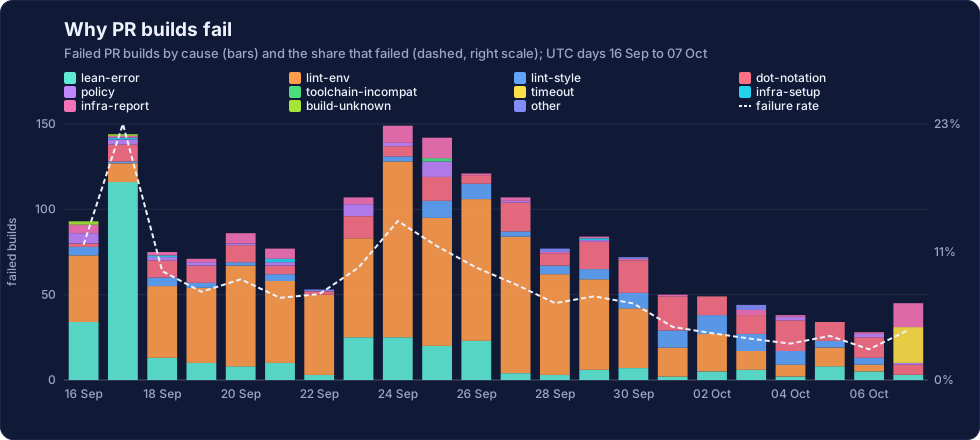
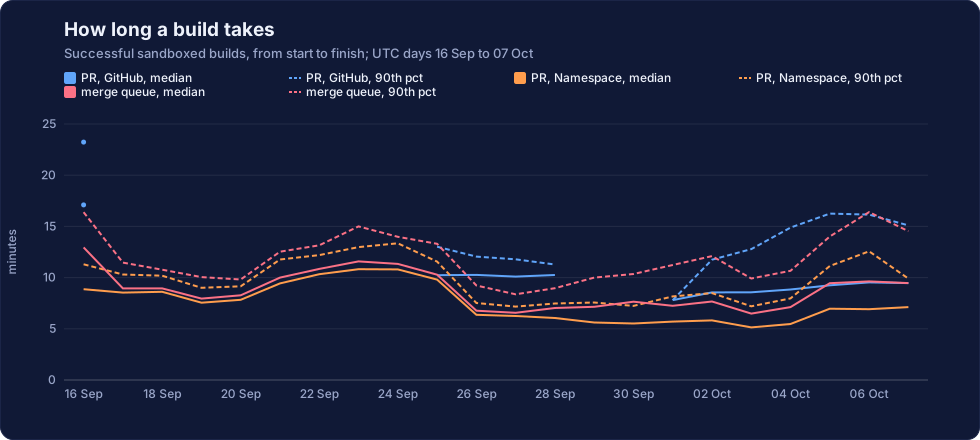
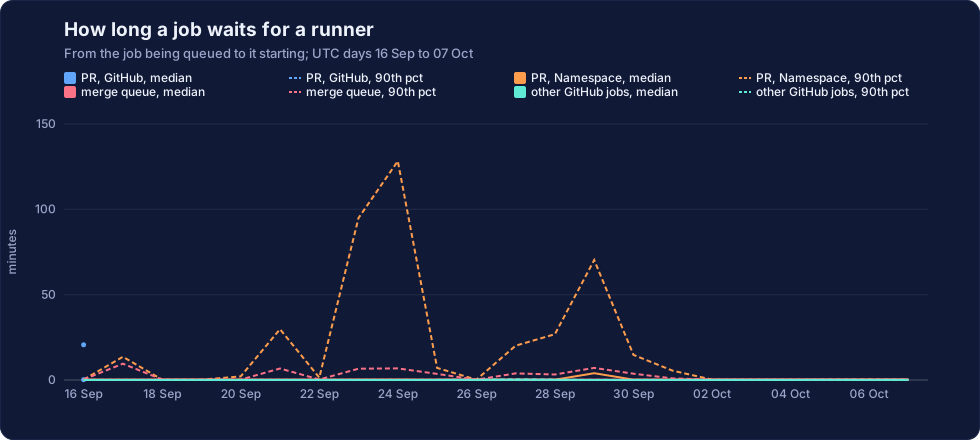
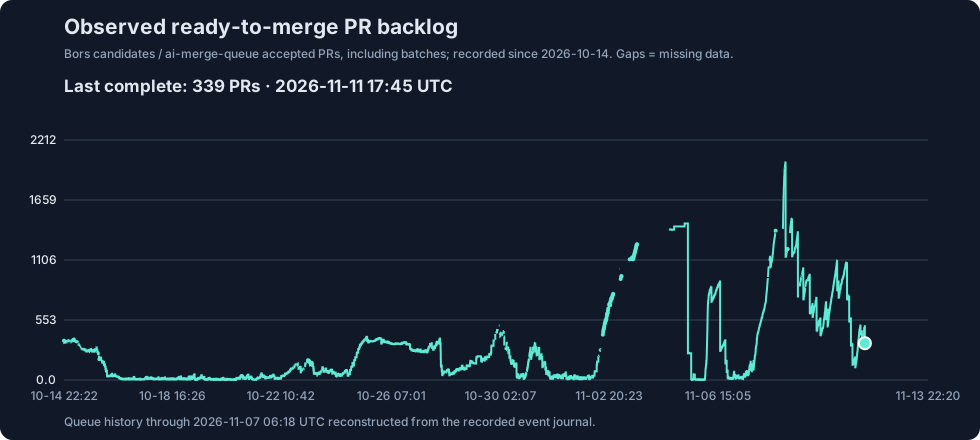
CI charts are drawn by the CI service from TauCetiCI, which has the full set and its methodology. Pipeline figures are regenerated every three hours.